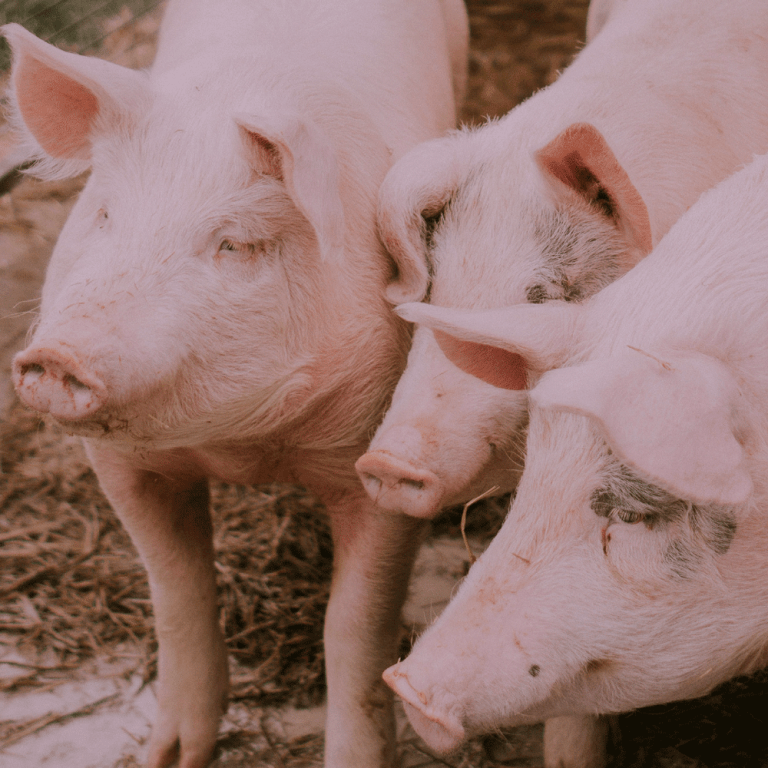
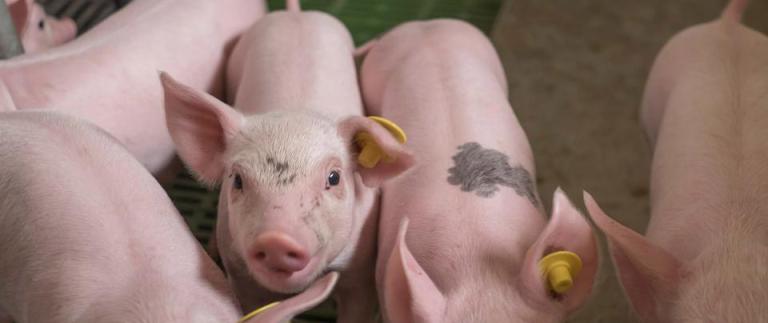
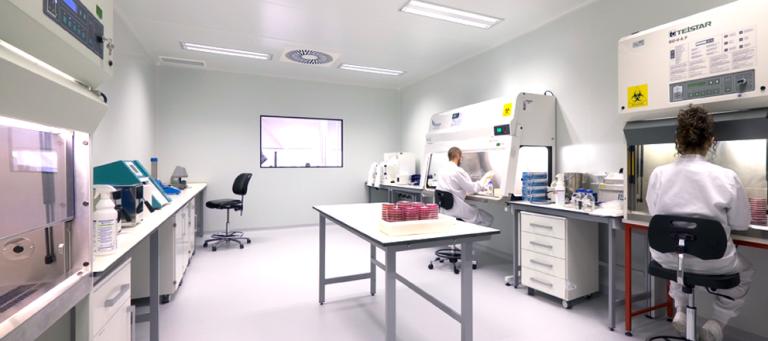
Identification of PRRS virus can be accomplished by the detection of viral proteins (antigen), by virus isolation and by the detection of nucleic acids.
Immunohistochemistry (IHC) and in-situ hybridization (ISH).
PRRS virus antigen or genome can be detected in tissues by IHC and ISH, respectively. The relationship between viral detection and lesions can be established by a combination of IHC or ISH and histopathology.

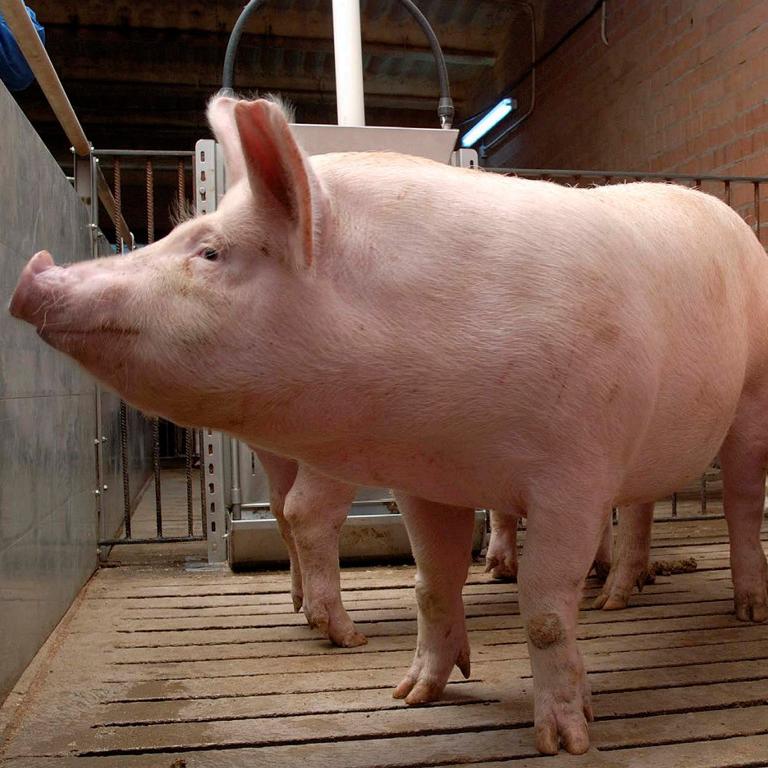
Virus isolation and titration.
Whereas type 2 strains can be isolated in both porcine alveolar macrophages and sublines of the African monkey kidney cell line (CL-2621 and MARC-145), some type 1 and European-like viruses can only be isolated in porcine alveolar macrophages. Since cytopathic effects, which occur in 1-4 days, are not always evident, virus isolation usually needs to be confirmed by RT-PCR, IPMA or IFA (maximum sensitivity at 7 days). Virus titration can be done using serial dilutions of sample.

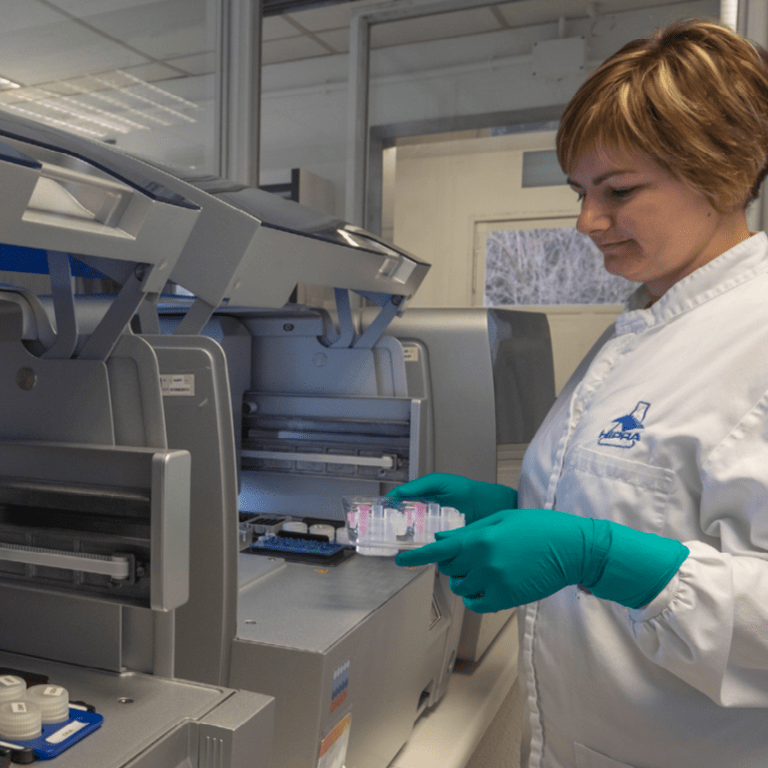
Conventional reverse transcription-polymerase chain reaction (RT-PCR).
Detection of PRRS virus genome. RT-PCR, together with ELISA, is the most commonly performed diagnostic test for PRRS. It is based on detecting and amplifying a specific segment of the genome. It is more sensitive than virus isolation, but since it detects the genome, a positive result RT-PCR does not imply the presence of viable virus.
RT-PCR is usually used to amplify ORF5 and ORF7 regions. Its sensitivity is variable since there is no fully validated, internationally-accepted RT-PCR and usually each laboratory designs its own RT-PCR assay (home-made). Depending on the design, a variable number of false negatives could exist. It can be used to distinguish genotypes.

Real-time RT-PCR / quantitative RT-PCR (qRT-PCR).
It is based on the amplification and quantification of a specific segment of the genome. As occurs with conventional RT-PCR, there is a lack of uniform assay performance between labs; at present, two commercial qRT-PCR assays are available in some countries, but in several labs it is a home-made assay. Therefore, a variable number of false negatives could exist; this usually depends on the expertise of the lab in standardizing and improving its assay. Sensitivity is similar or slightly higher than conventional RT-PCR. It can be used to distinguish genotypes.

Restriction Fragment Length Polymorphism (RFLP). It involves ORF5 digestion by three restriction enzymes. As a result, a three-digit pattern is generated; this was used to differentiate isolates, however it has been demonstrated that different isolates can share similar RFLP patterns. Therefore, sequencing is better than RFLP to differentiate isolates.
Sequencing. DNA obtained during the RT-PCR assay can be sequenced with the purpose of obtaining the order of nucleotides of the genome. DNA sequencing is useful to discriminate between individual strains. Usually, the relatedness among different isolates is done comparing ORF5, ORF6 or ORF7 sequences.
Through sequencing it is possible to: 1) distinguish genotypes; 2) distinguish field-virus isolates from vaccines; 3) obtain valuable epidemiologic information useful for determining the source of infection, how many strains are present in a herd/farm/population, which is the most prevalent, etc. In general, if sequences are frequently obtained, we can determine the main source of infections and how isolates circulate in one herd or in a region. Eventually, we could use this information to establish better measures for PRRS control.
At present, through sequencing it is not possible to: 1) (in general) predict the virulence of a given isolate; or 2) predict cross-protection between two isolates, since genetic markers of virulence and cross-protection have not been identified.
Sequencing should not be used to choose a vaccine against a given isolate, since it has been demonstrated that the overall level of homology (relatedness) between two strains is not related to the level of cross-protection that could exist between them.
In order to compare the degree of similarity among isolates and to group them according to their sequences, a tree diagram, known as dendrogram, can be drawn. Thus, dendrograms are useful to detail relationships among various isolates.

Phylogenetic tree (dendrogram) obtained by the analysis of seven ORF5 sequences from four different origins. The bar represents 0.1 nucleotide substitution per site. Interpretation: in this dendogram, for example, one unrelated strain from origin 1 is present (O1-I3) (similarity to O1-I1 and O1-I2, 93.4% and 93.2%, respectively); whereas similarity between I1 and I2 from origin 1 is 97.5%. In origin 2, two unrelated strains are also present (similarity between I4 and I5 from origin 2 is 96.6%).The strains I6 and I7 from origin 3 are closely related (>99.8% identical).
It is commonly accepted that two isolates are different if similarity between them is below 97% (ORF5). However, this cut-off point is completely arbitrary. In order to avoid misinterpretations, additional information, such as dates and locations of isolations, as well as the relationships among farms or origins, should be taken into account.